An interactive, three-page Power BI dashboard built on 120+ years of Olympic data. The goal wasn’t only to visualise — it was to build a clean end-to-end pipeline (ingest → clean → model → measure → present → drill through) and to debug the real problems that surfaced along the way.
01 Demo
02 Three questions
- How has gender equality at the Olympics evolved over time?
- Which countries dominate the medal table — and how does that shift between Summer and Winter Games?
- How do athlete body types vary across sports?
03 How it was built
Data cleaning (Power Query)
- Mixed date formats in
born— some full dates, some year-only. Rather than forcing a date type (which errors the whole column), I extracted the trailing 4-digit birth year into a clean integer. - Text in
height/weight— converted types in Power Query, then Replace Errors → null, the standard two-step for messy numeric columns. Bad values become null and drop out at the measure level. - Nulls in
medal→ “None” so medal status is explicit and countable; season derived fromeditionto power the slicer. No blind dedup — uniqueness isathlete_id+result_id.
Data modeling
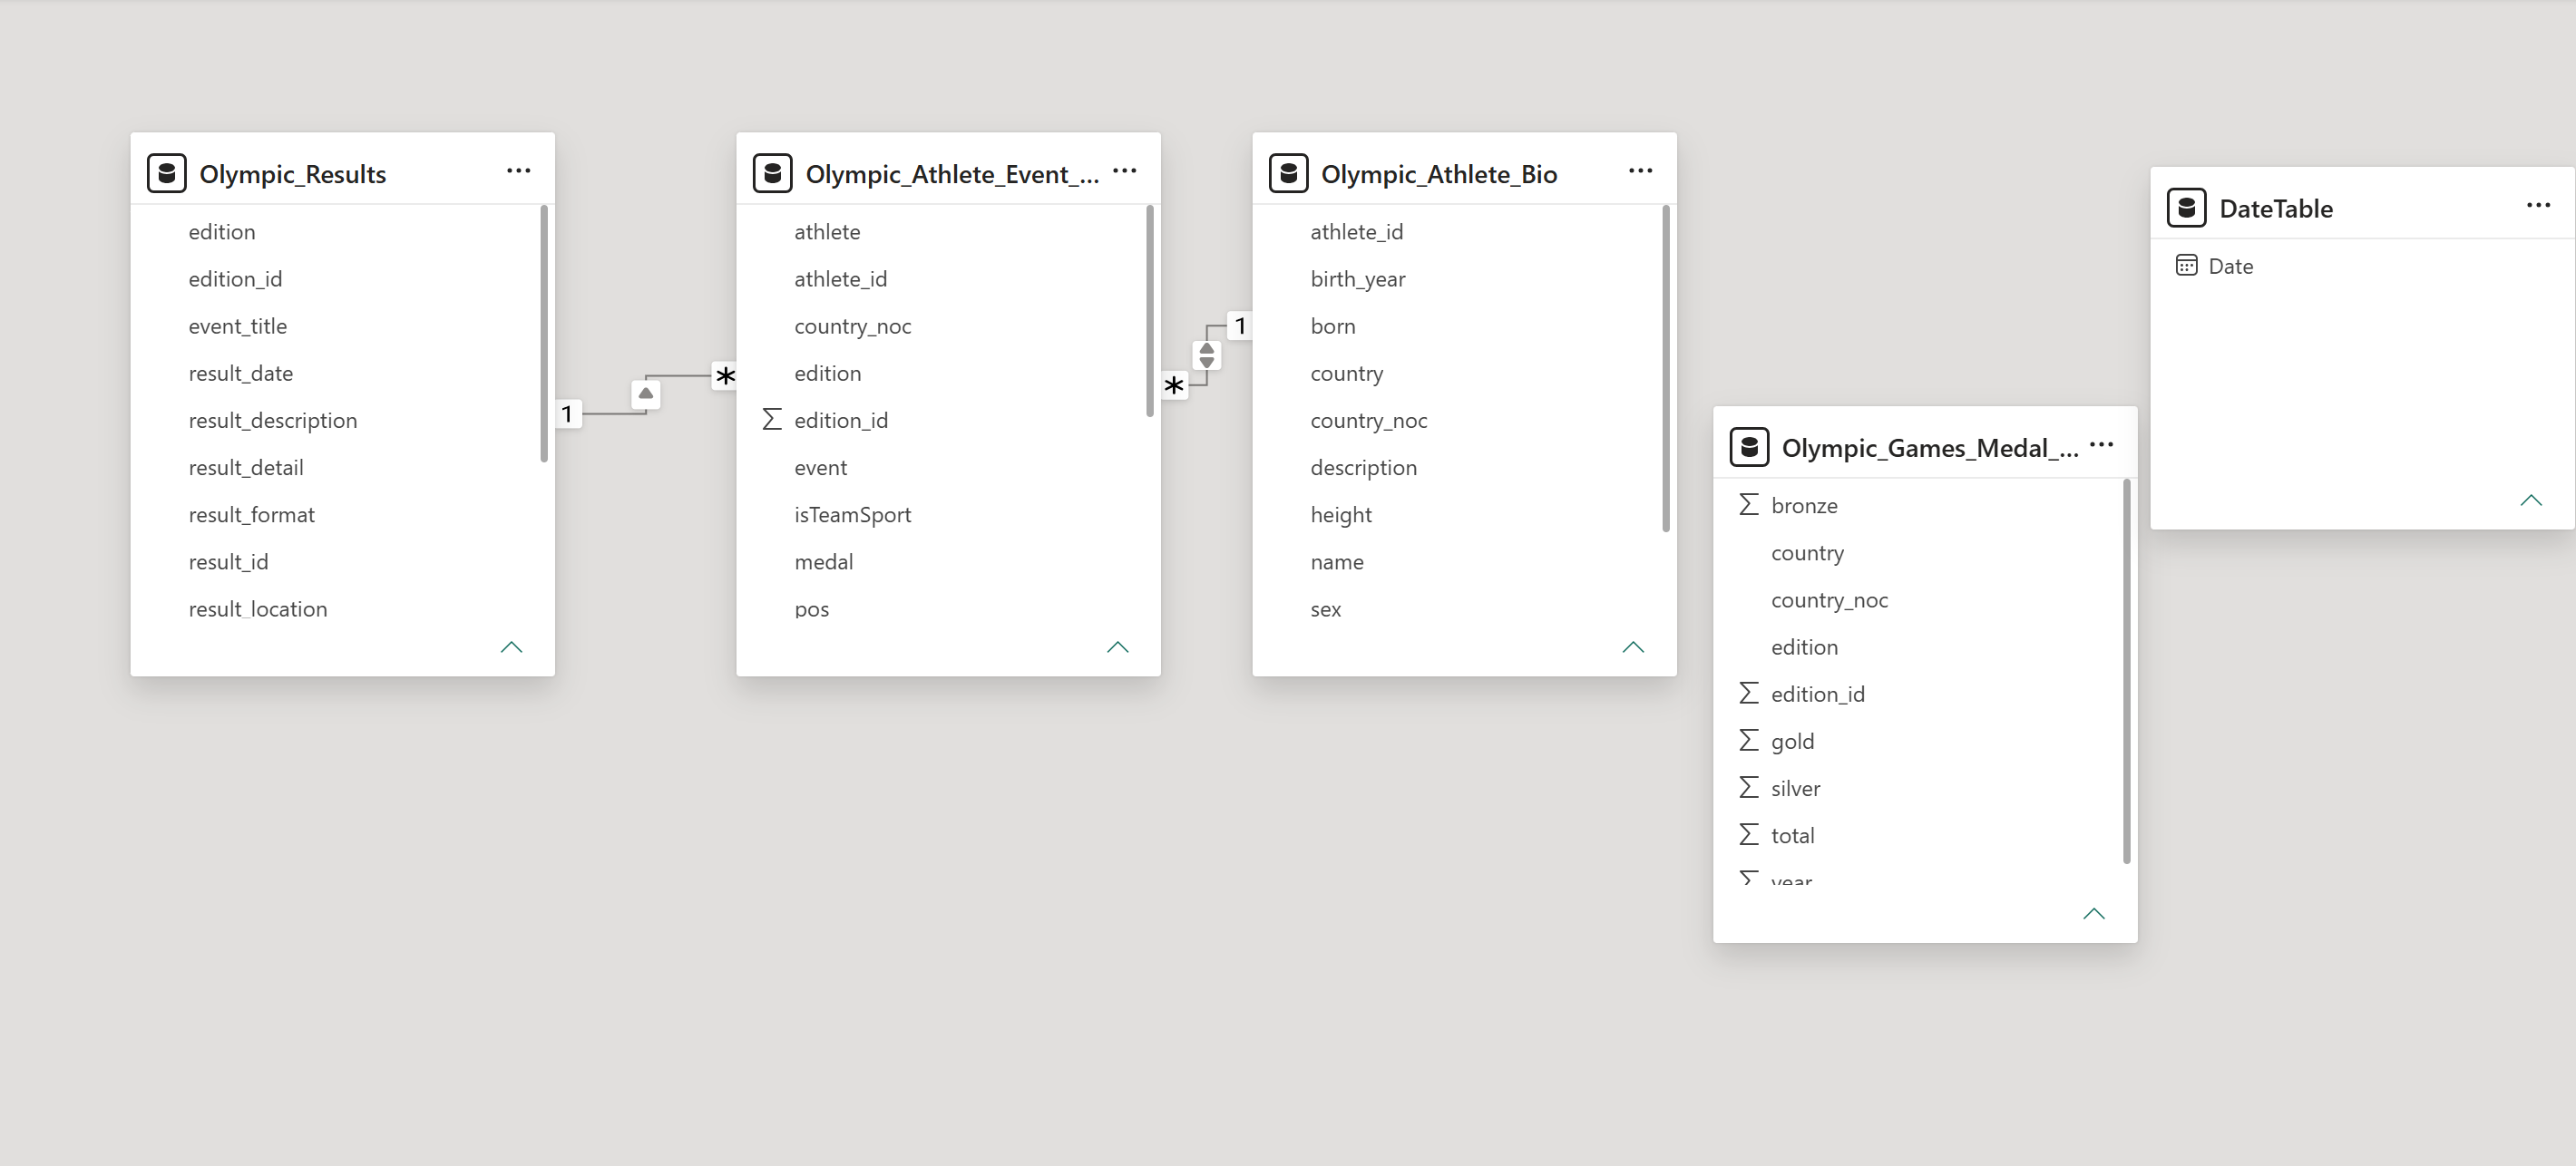
A star schema with the results fact table at the centre, with the athlete-bio and event-results dimensions joining in. The medal-tally table is intentionally left unrelated — it sits at a different grain (country × edition) than the fact table (athlete × event), so it’s kept purely for validation.
DAX measures
The core measures use FILTER so filter contexts stack correctly (see the debugging notes), plus a dynamic drill-through title built with SELECTEDVALUE:
Total Medals =
COUNTROWS(FILTER('Olympic_Athlete_Event_Results',
    'Olympic_Athlete_Event_Results'[medal] <> "None"))

Female % =
DIVIDE(
    CALCULATE([Total Athletes], 'Olympic_Athlete_Bio'[sex] = "Female"),
    [Total Athletes])

Detail Title =
"Medal Breakdown — " &
SELECTEDVALUE('Olympic_Athlete_Event_Results'[country_noc], "All Countries")
04 The dashboard
Page 1 — Overview
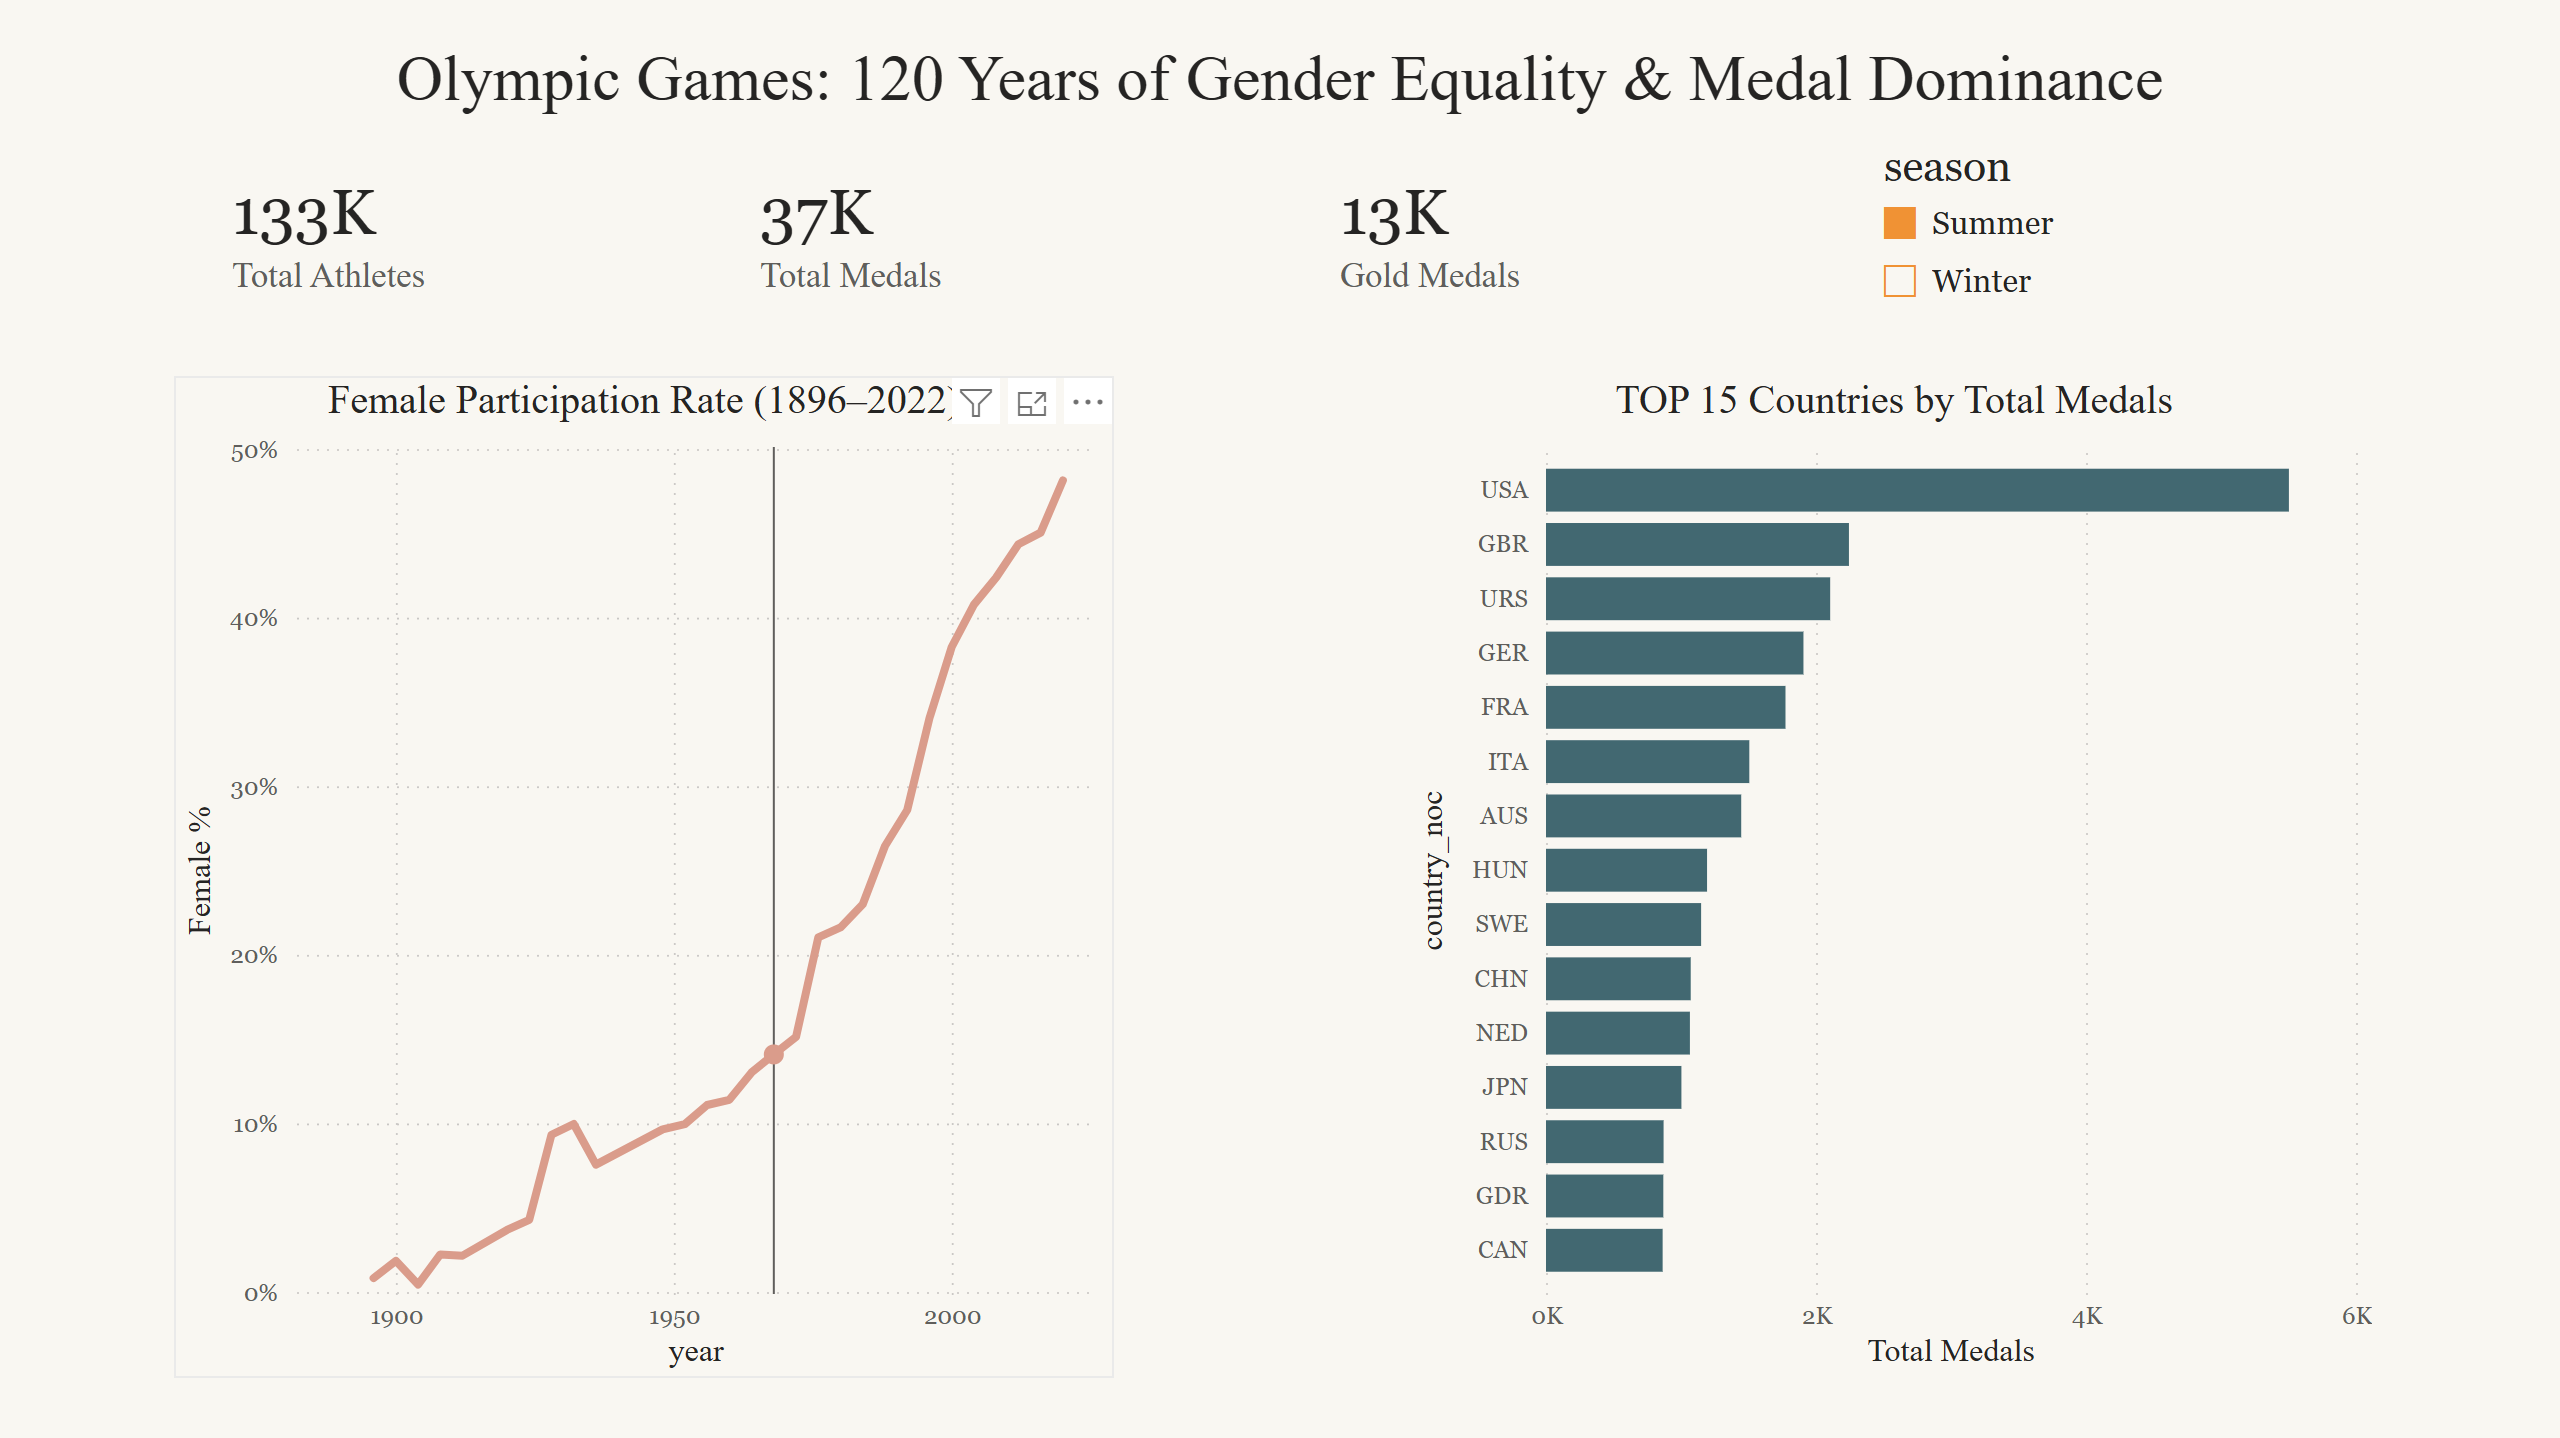
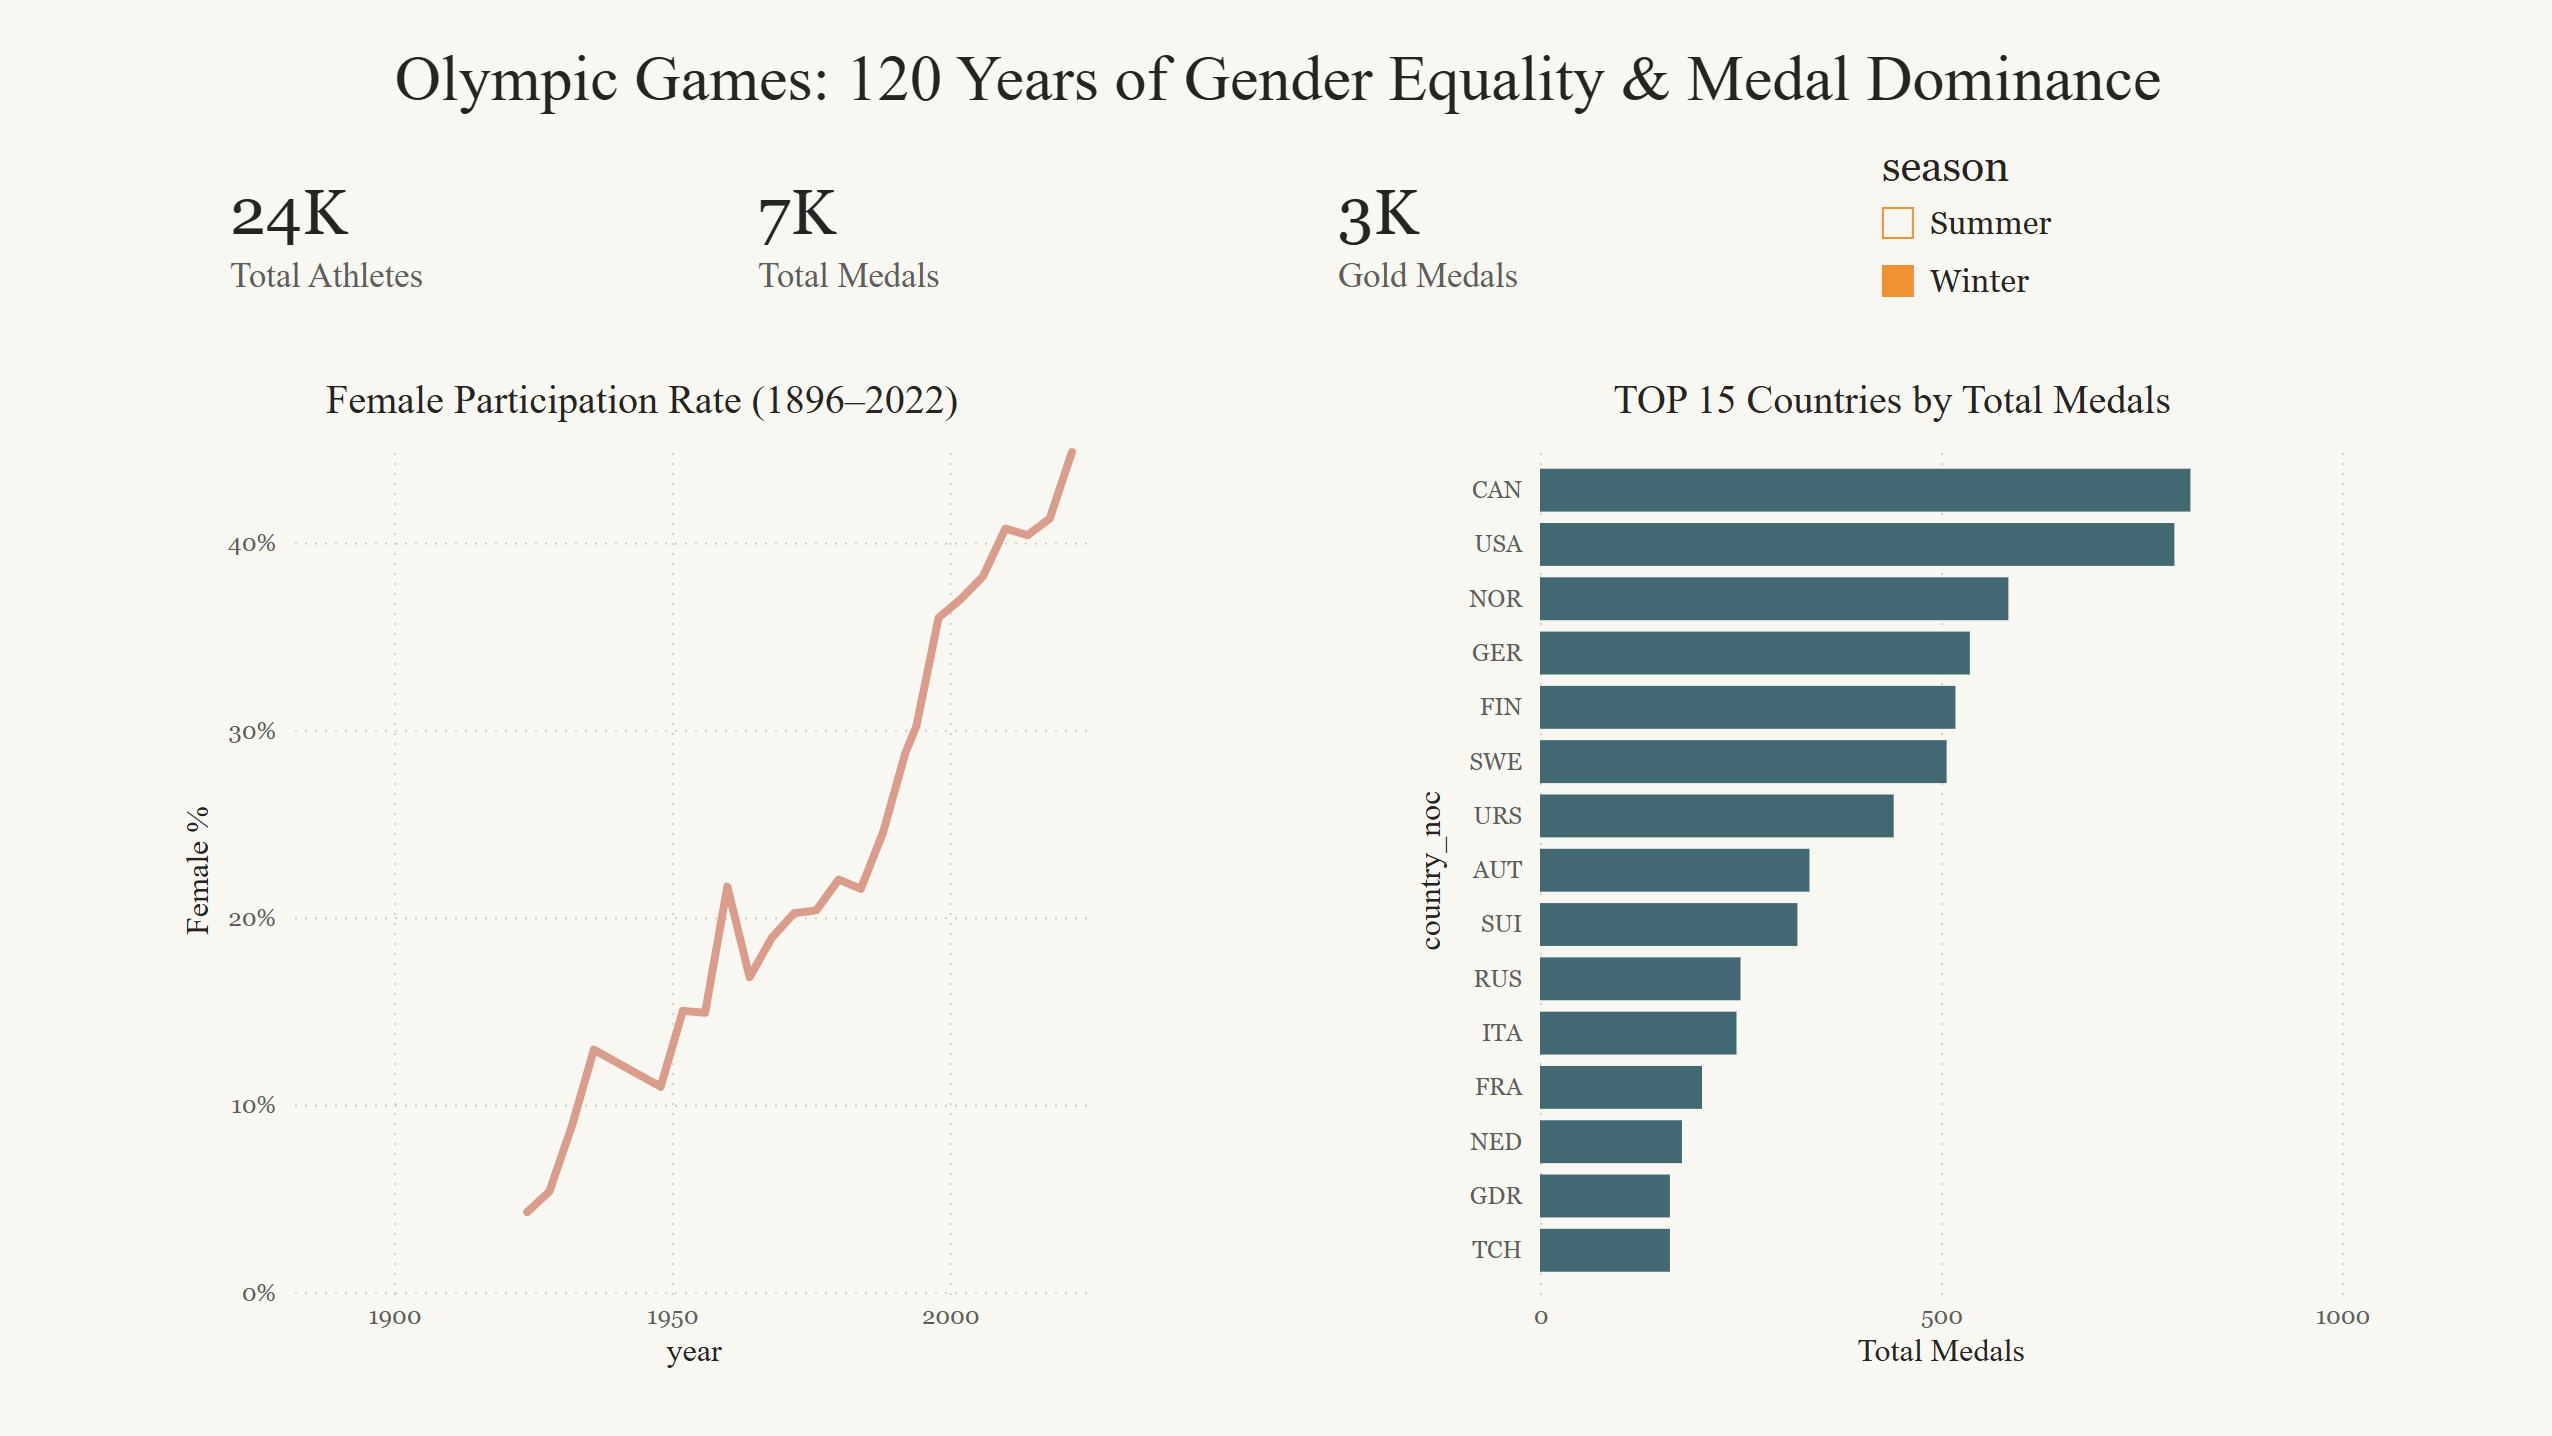
KPI cards, a line chart of female participation over time (the core narrative), a Top-15 countries bar chart, and a season slicer — all cross-filtered. Switching to Winter reshuffles the leaderboard entirely.
Page 2 — Athlete Physique
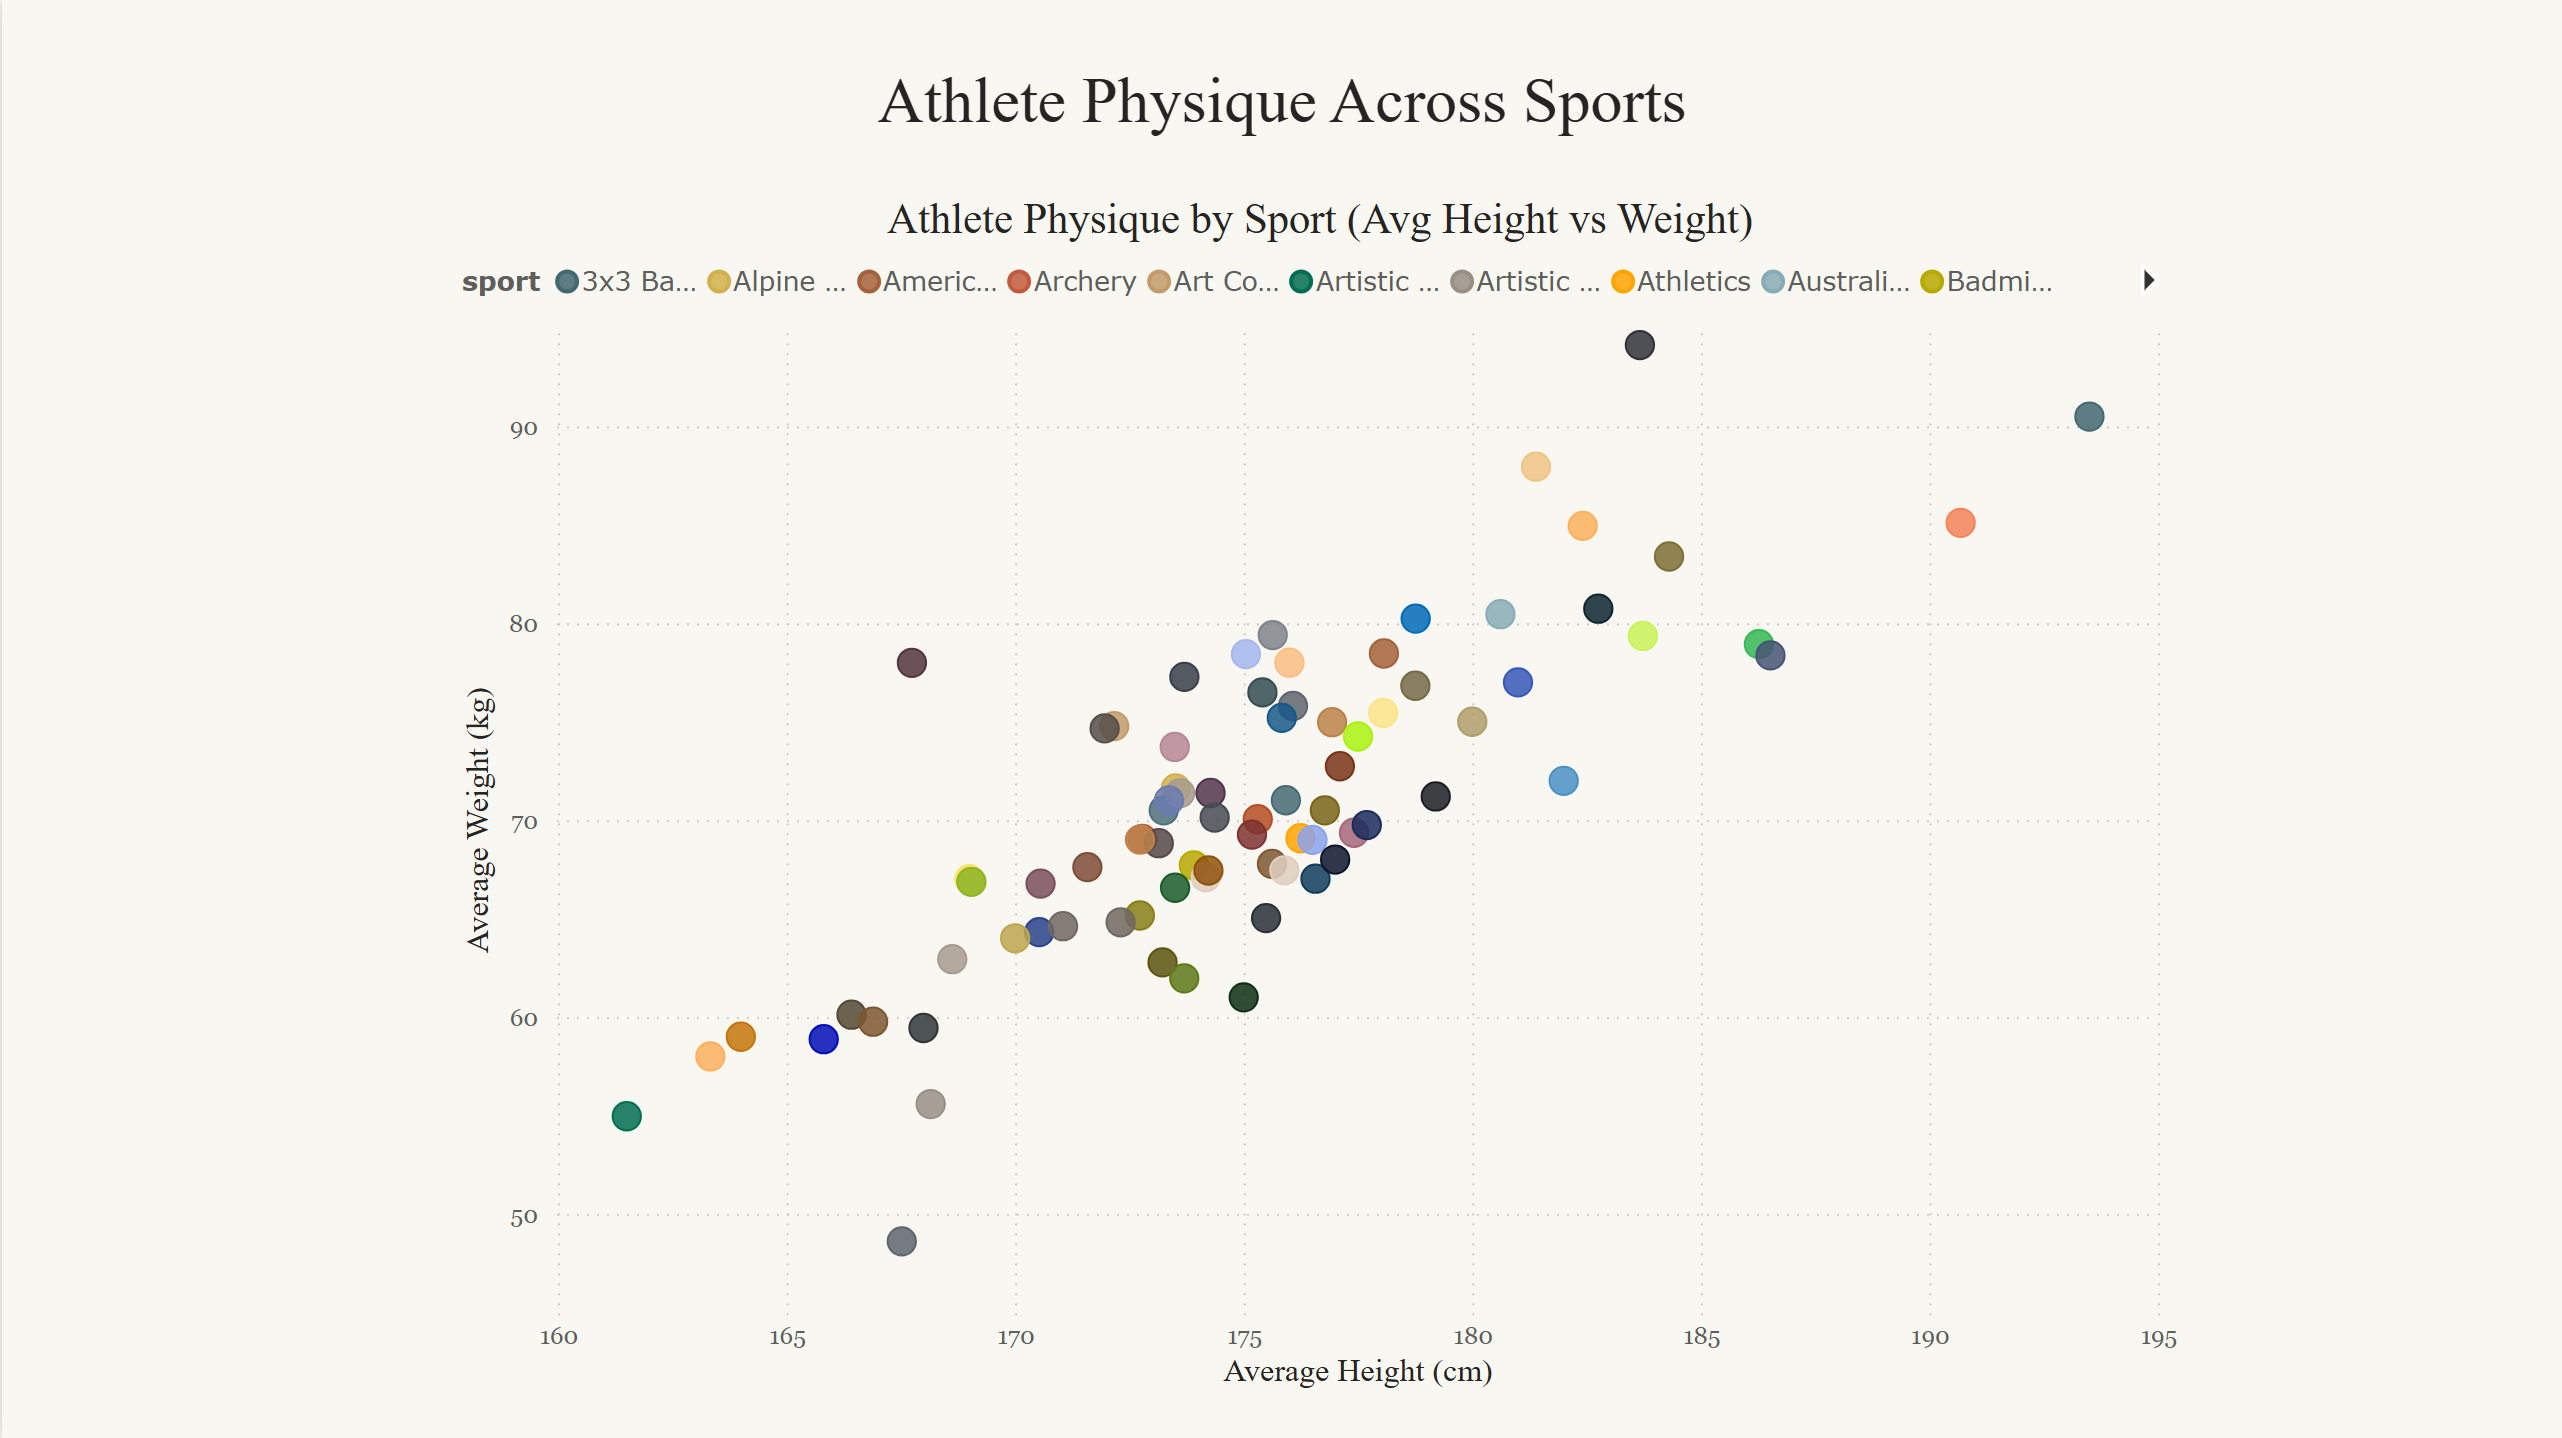
A scatter of average height vs. weight by sport, revealing a clear positive correlation and distinct clusters — tall, heavy sports like rowing and basketball vs. compact ones like gymnastics.
Page 3 — Country Detail (drill-through)
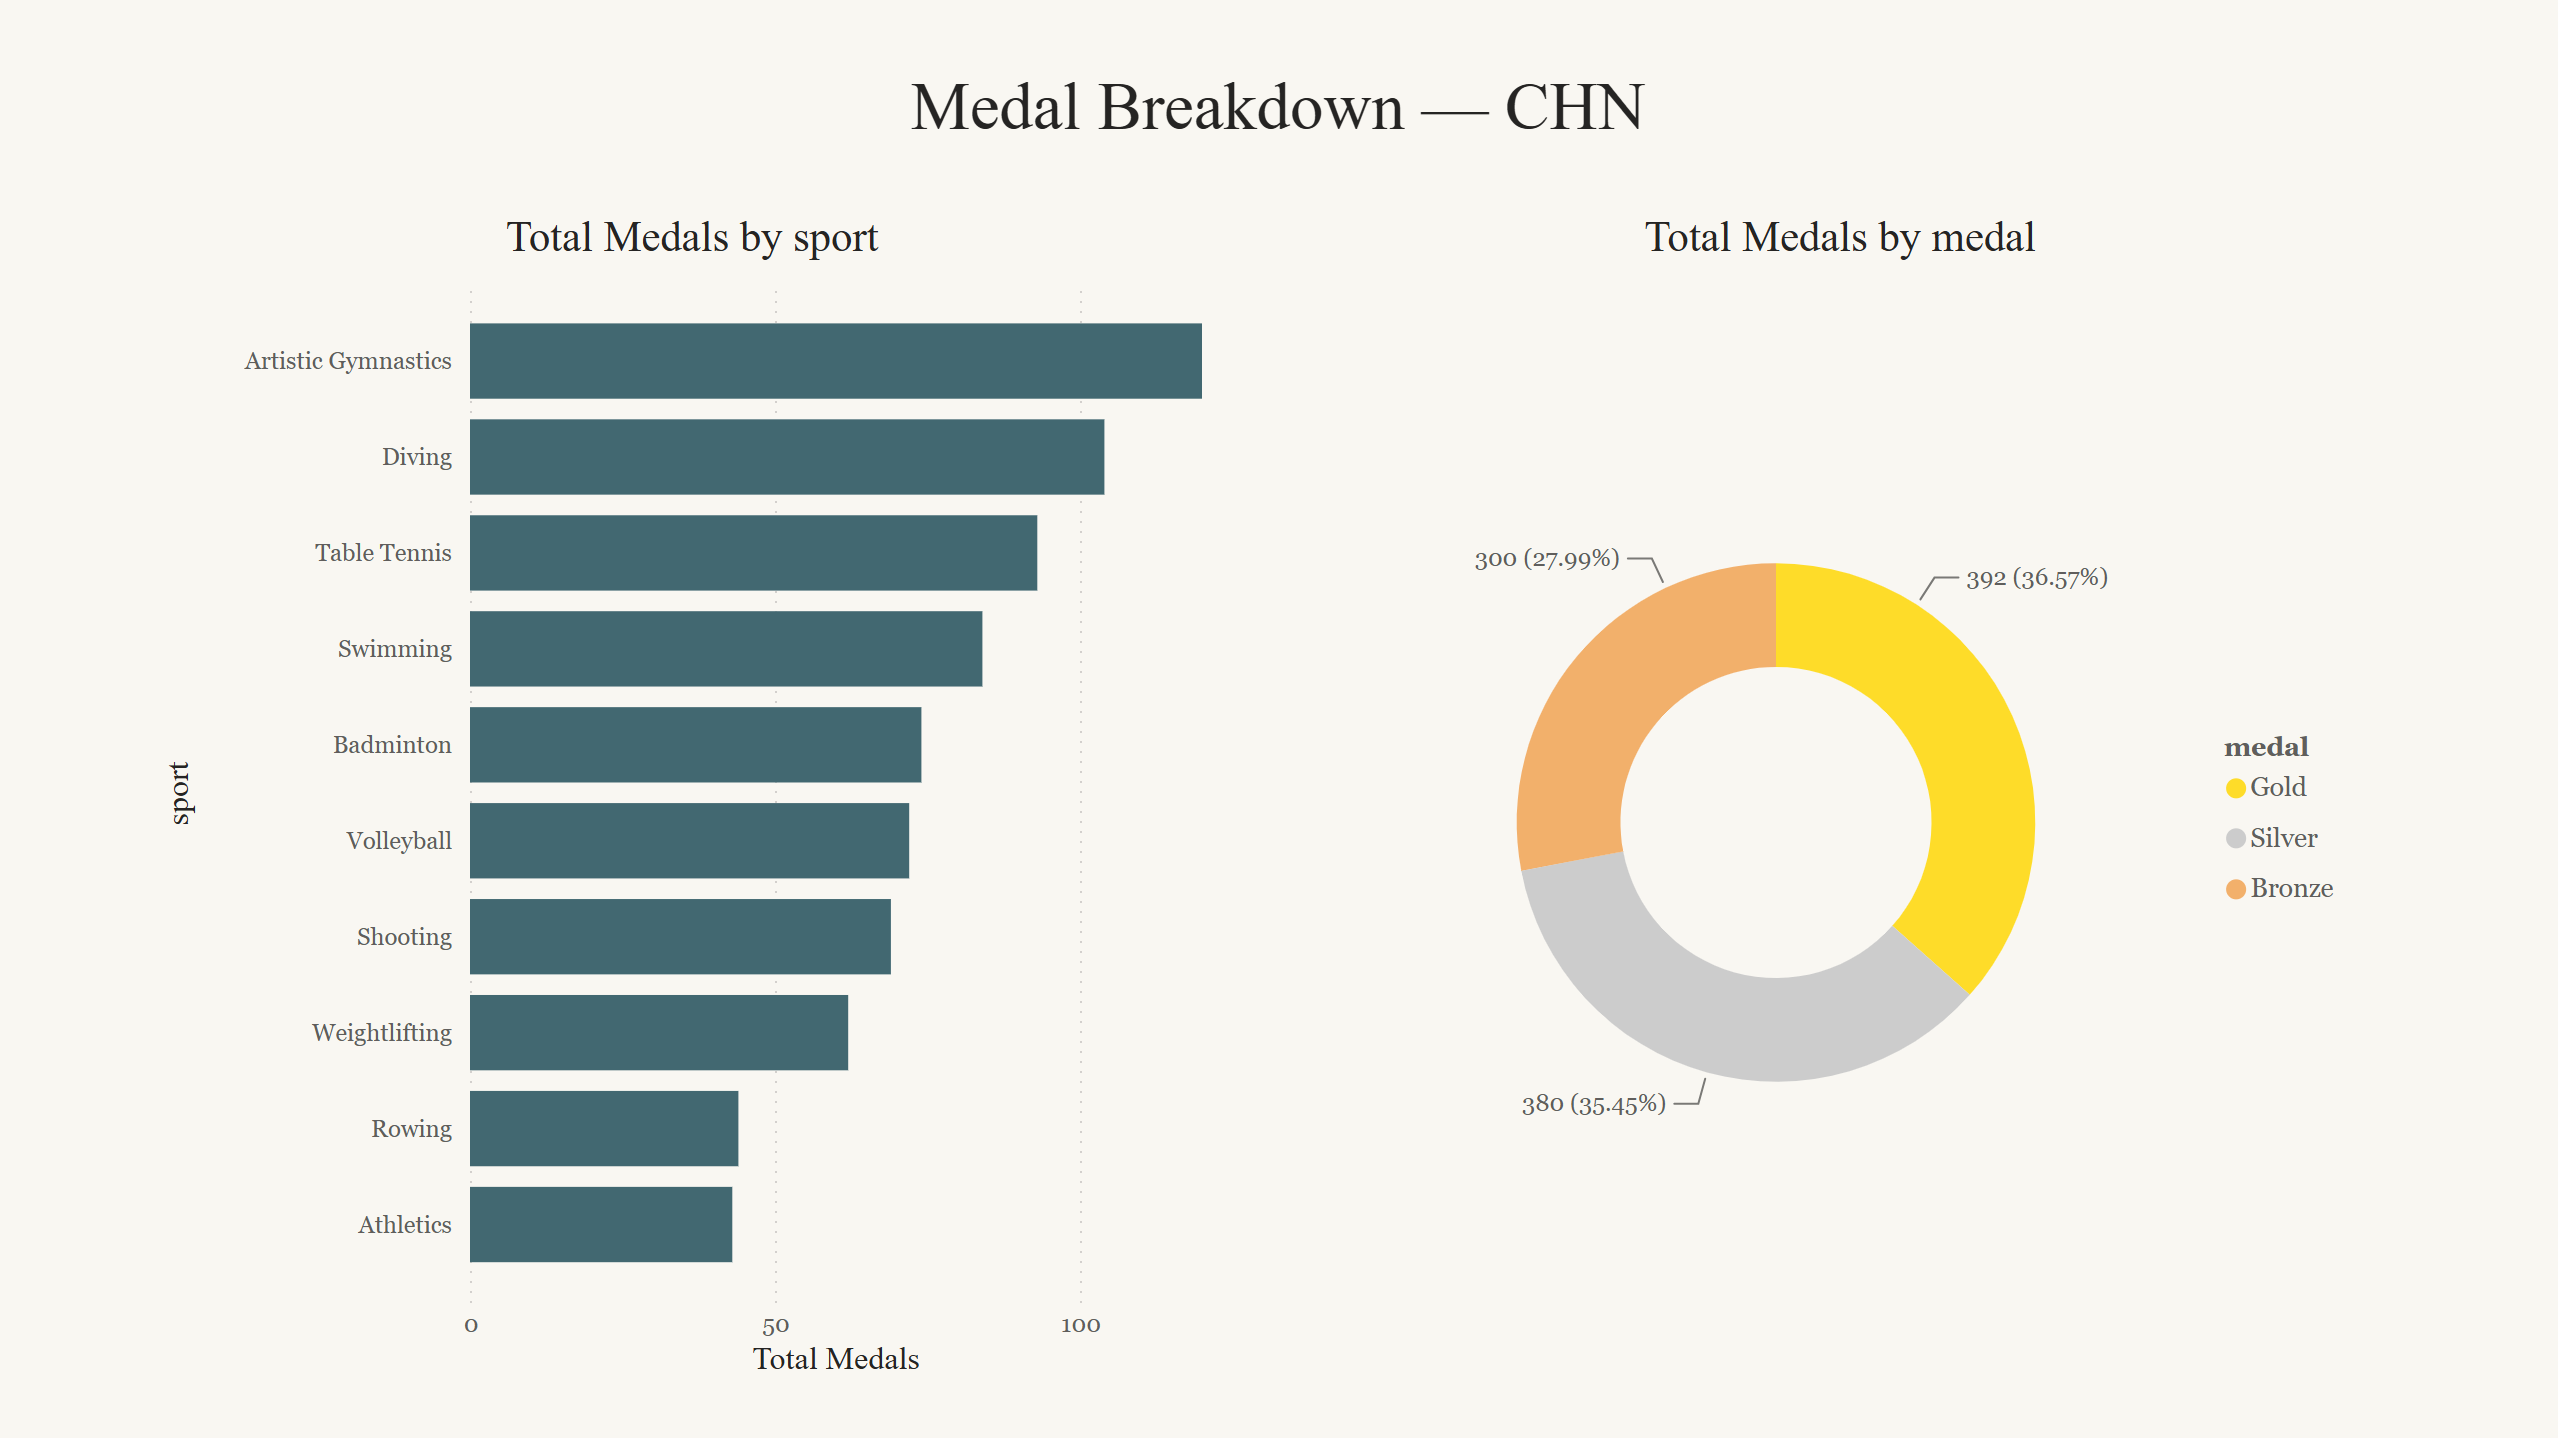
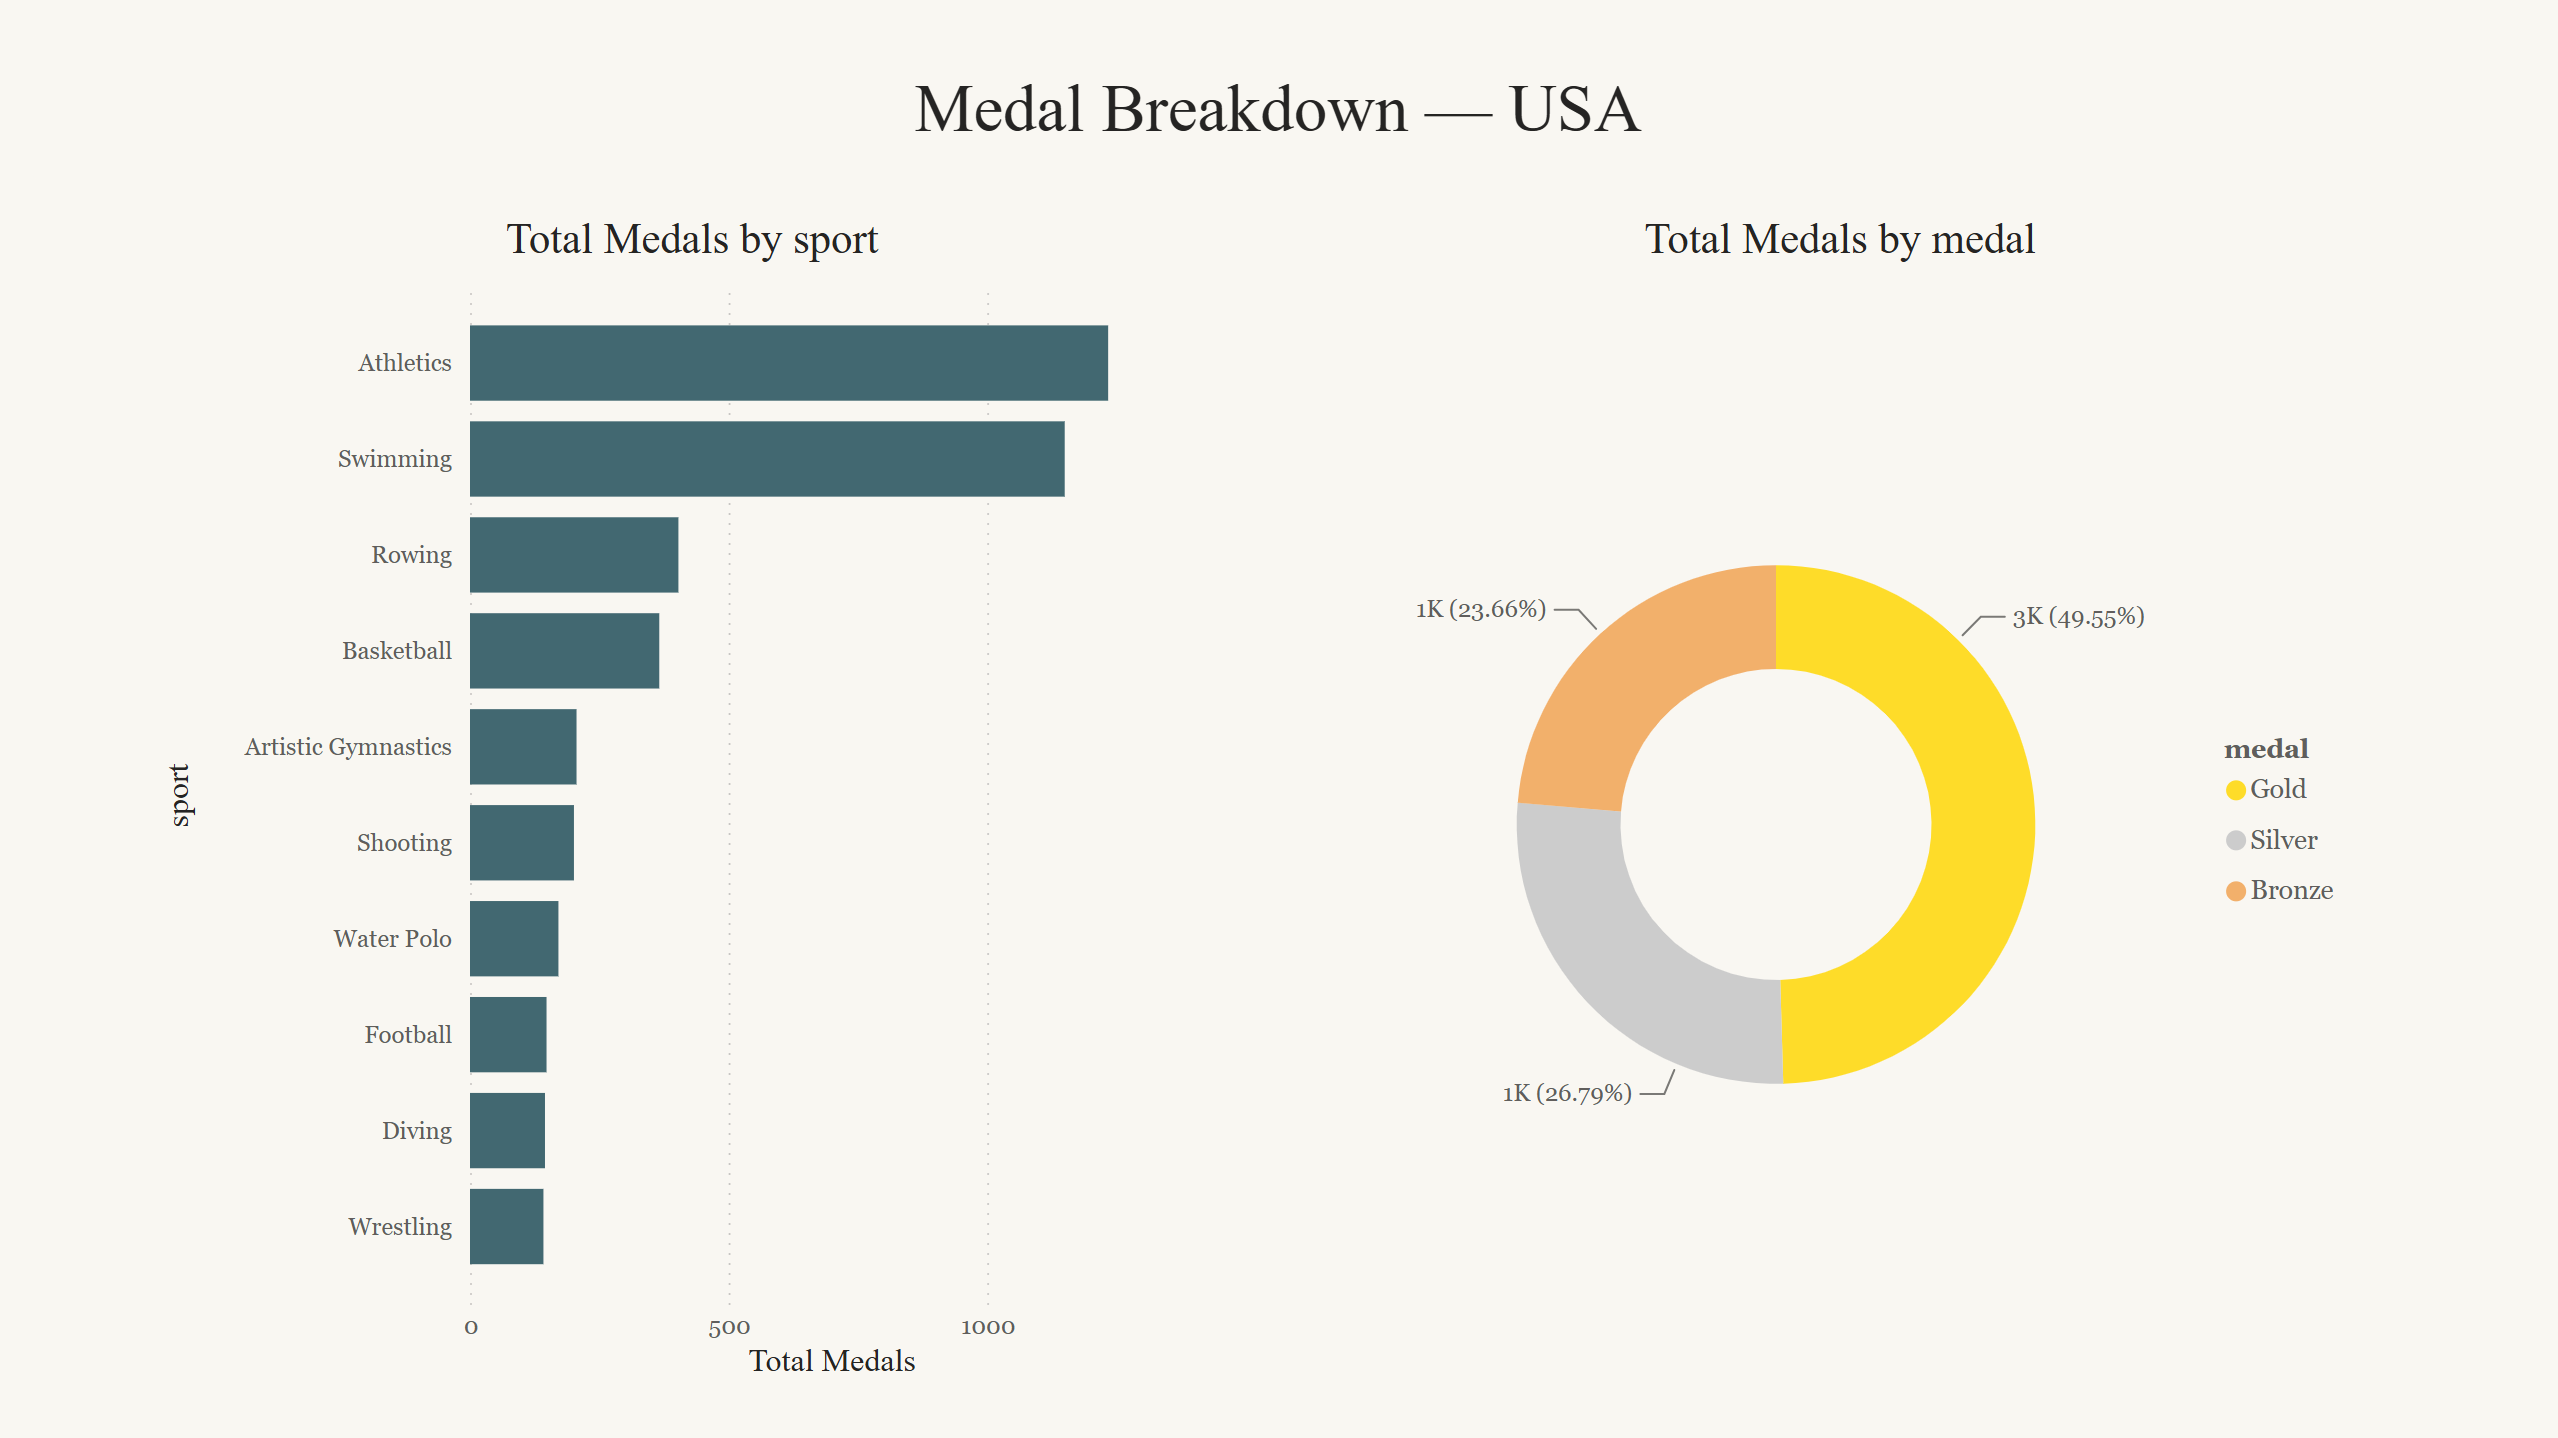
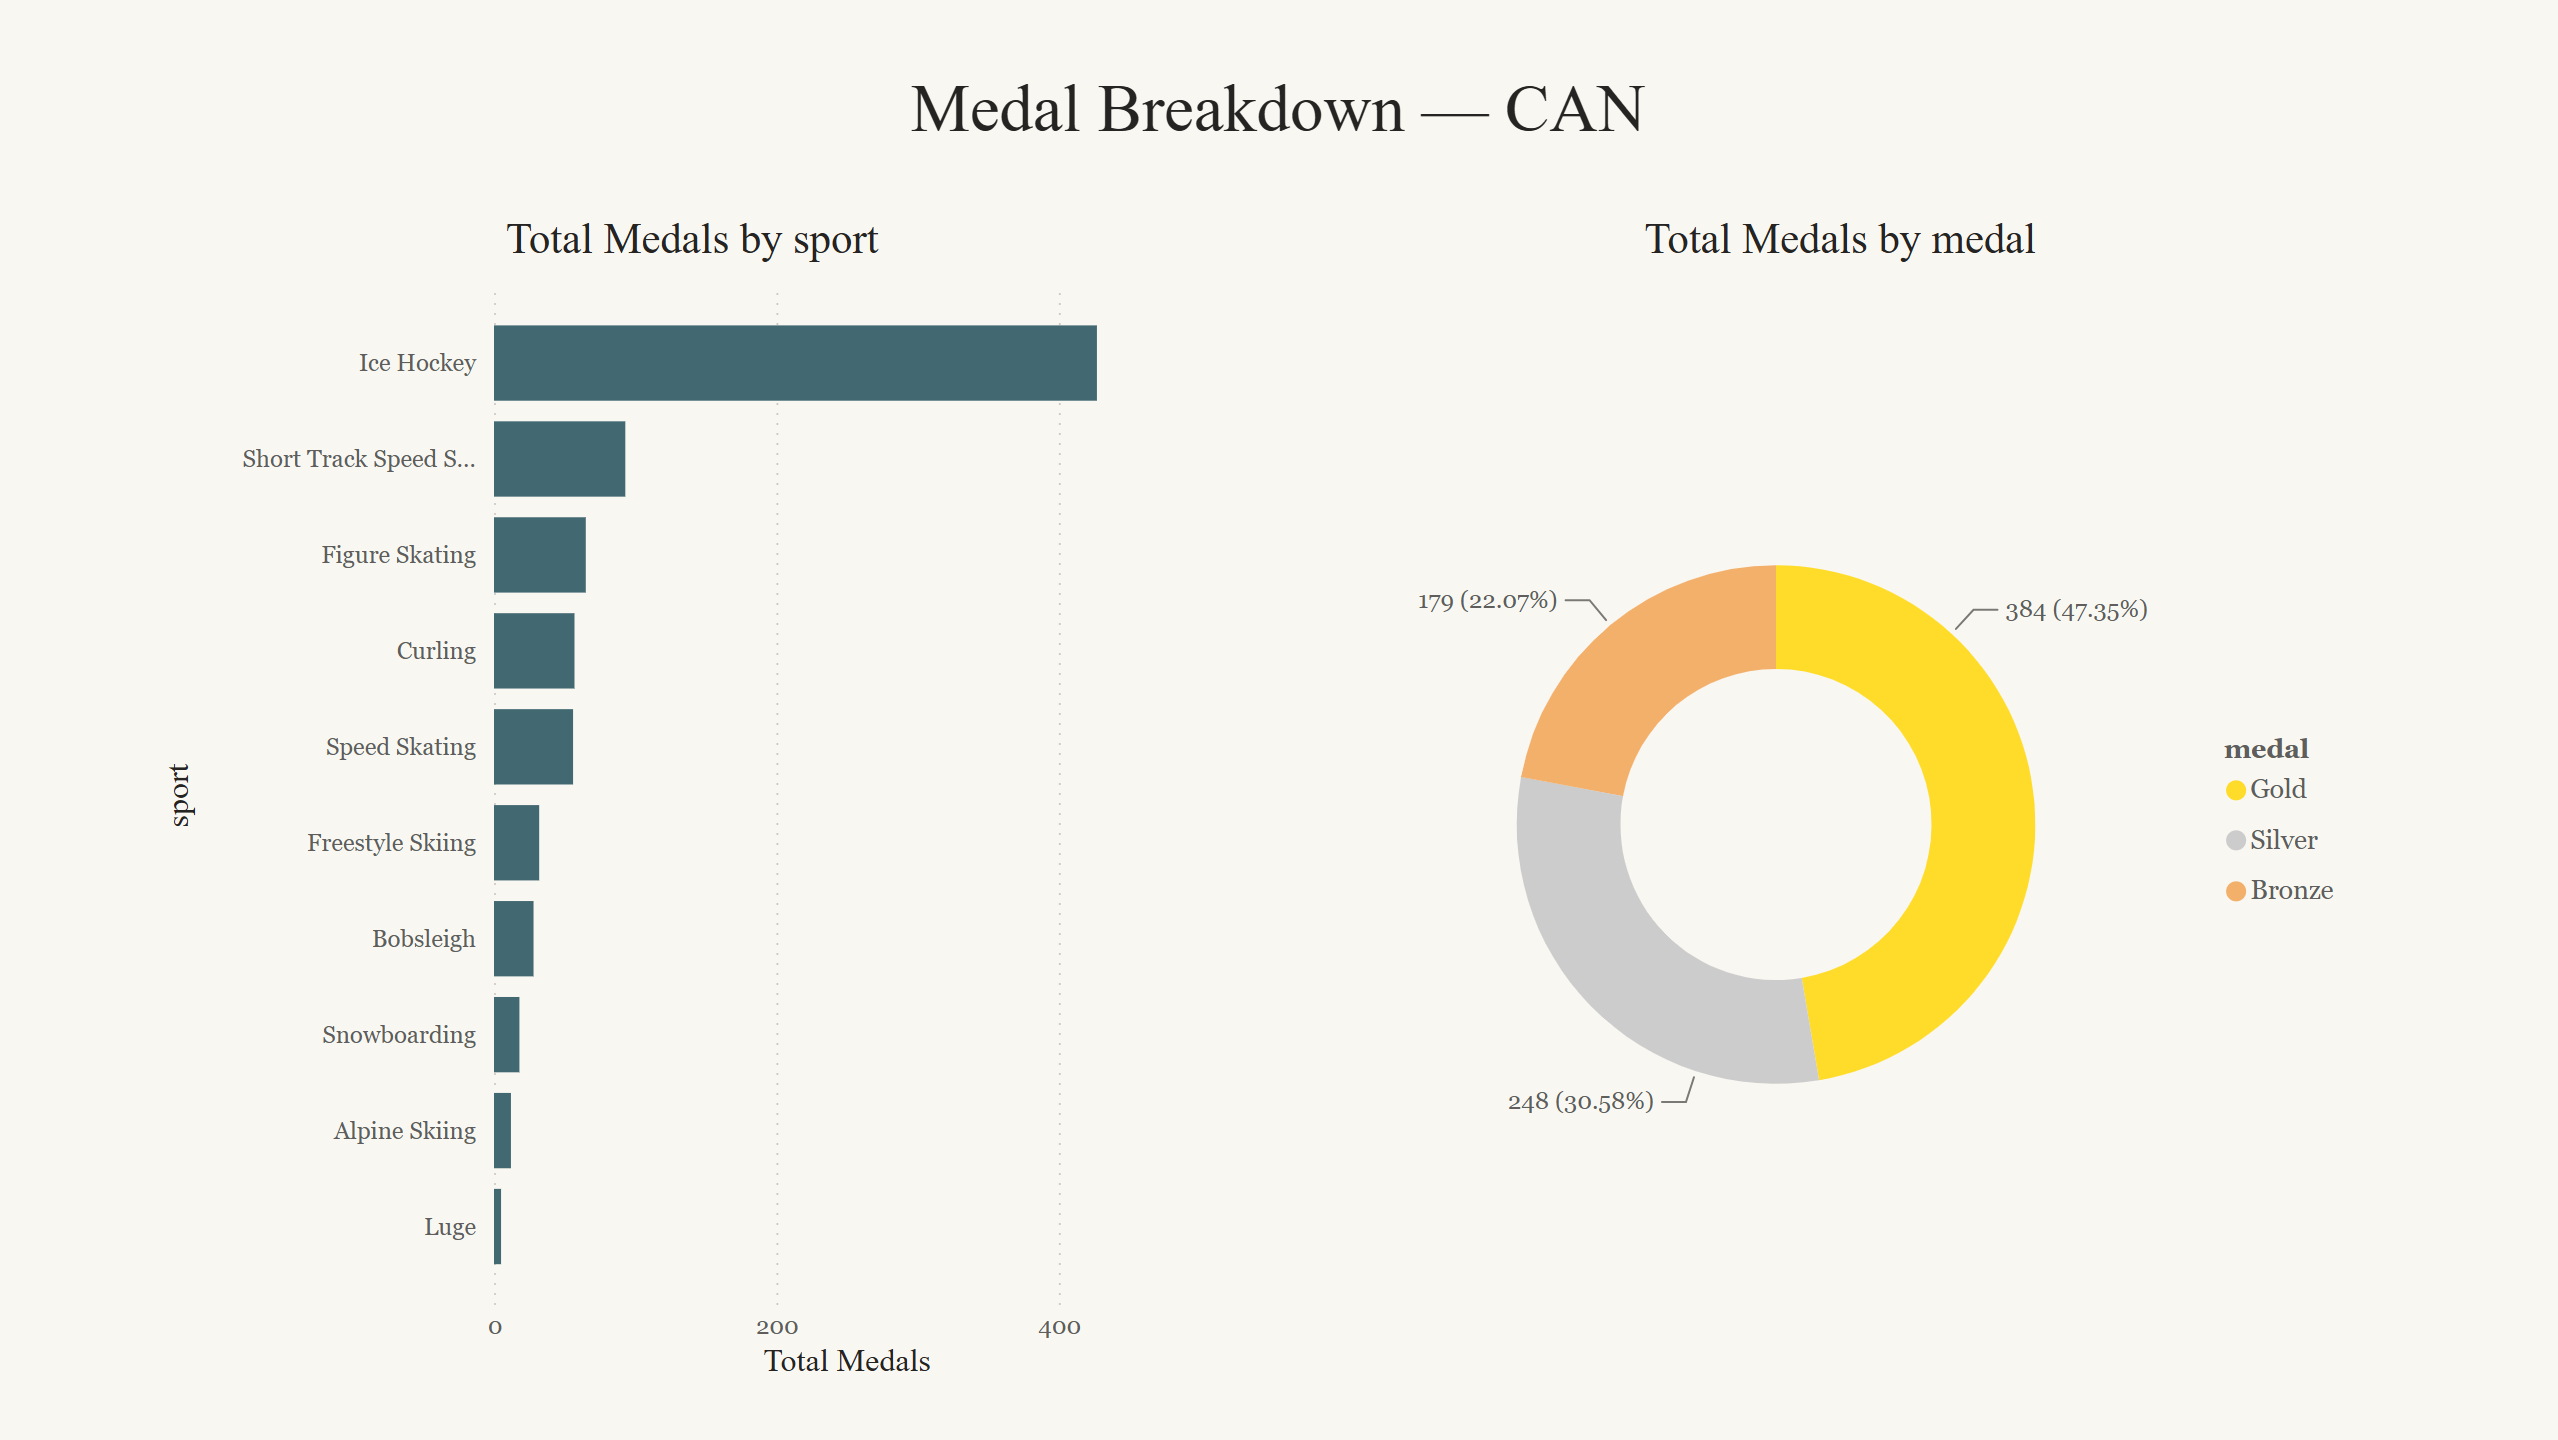
Right-click any country → Drill through → a detail page of that country’s medals by sport and its gold/silver/bronze breakdown (coloured to match the medals). A dynamic title built with SELECTEDVALUE names the selected country, and the season context carries through.
05 Debugging notes (the interesting part)
Several real problems surfaced — diagnosed and fixed:
Gold Medals equalled Total Medals
The original measure wrapped [Total Medals] in CALCULATE with a medal filter, but the inner CALCULATE overrode the outer context. I verified with a DAX query, then rewrote both measures using FILTER so the filters stack.
Scatter plot collapsed to a single point
sport (fact) couldn’t slice height/weight (bio) because the cross-filter direction was single. A SUMMARIZECOLUMNS query confirmed identical averages everywhere; setting the relationship to bi-directional fixed it.
A bad replace overwrote the whole medal column
An early medal replacement wrote “None” over everything. Caught it by listing distinct values via a DAX query, reverted the step, and used a safer replacement.
06 Key insights
- Female participation rose from under 2% in the early Games to roughly 45–50% in recent editions.
- Medal dominance concentrates in a handful of nations, and the leaderboard reshuffles entirely between Summer (USA, GBR, URS) and Winter (CAN, NOR, GER).
- Athlete physique clusters tightly by sport — a clean, interpretable signal.
The full write-up, DAX, and the .pbix file are on GitHub.
View on GitHub